A Prehistoric Mapping Adventure
Recently we worked on a small interactive map for Australia’s Dinosaur Trial. Australia’s Dinosaur Trail (ADT) is an exciting adventure in Queensland’s Outback, where you can follow in the footsteps of the prehistoric creatures that once roamed Australia.
The goal of the application was to make a map that supported a set of existing itineraries as suggested by the local organizing committee of the ADT. You can check out the information we had to work with here.
Visitors passing through this area may know something about the prehistoric history and significance of these great plains. But upon arrival they rely on ‘authoritative’ local knowledge about the place, in order to maximize their stay. We set out to provide an interactive experience for which they can explore the area before, and whilst on their journey.
View the application here:
ADT Branding
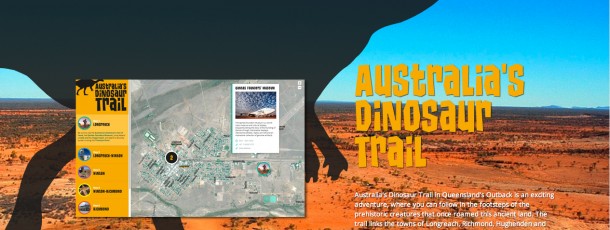
The ADT had an existing set of style guidelines that we needed to adhere to. A sample of one of their collateral pieces is shown below:
An example of the existing branding used by the ADT.
The Data
We began sifting through the content and itineraries to gain a deeper understanding of what we had to work with. It was obvious that we were going to need to be clever about how we presented the information, and the experience given the limited amount of content we had to work with.
The suggested itineraries page from the official ADT website.
What did we learn from the data?
The data was sparse in terms of content, and detail. Additional research was undertaken to enhance the content and make it more meaningful to the user. Images, URL’s, opening times and phone numbers were sourced for each point of interest (POI) along each route to bolster the content of the app.
In order to plot the positions of the POI’s we reverse geo-coded them. This gave an indication of the spread and density of the POI’s. As expected the dataset was unevenly distributed meaning that some of the POI’s where literally across the road from each other and some were 100 km from each other.
Brainstorming
Once the data was in place and understood we started brainstorming ideas based around what was important to the user, what was going to give us ‘visual impact’, and what functionality and tech was required in order for users to navigate their way around these vast dinosaur plains.
- Do we want to force users into visiting the POI’s in ordered sequence?
- How will we keep users orientated given the vast spread of the POI’s?
- How much information on the POI do we deliver, what is ‘acceptable’?
- What information do we push into the pop-up?
- How do we handle clustering (i.e. where POI’s appear to overlap close at a given scale)?
- How do we link the textural information about each ‘Day’ of the trail to the individual POI’s themselves?
- How can we make this functional, and of interest to our audience?
The list went on…
Sketching/Designing/Iterating/Trashing!
Our brainstorming session revealed to us that essentially what we needed to build was a simple point-on-a-map type app, with an ability to organize the POI’s from each day of the itinerary in some logical way. The ADT committee had broken down the trail into 7 days (Day 1: Longreach, Day 2: Longreach to Winton etc). Each day included 4 POI’s that we needed to map.
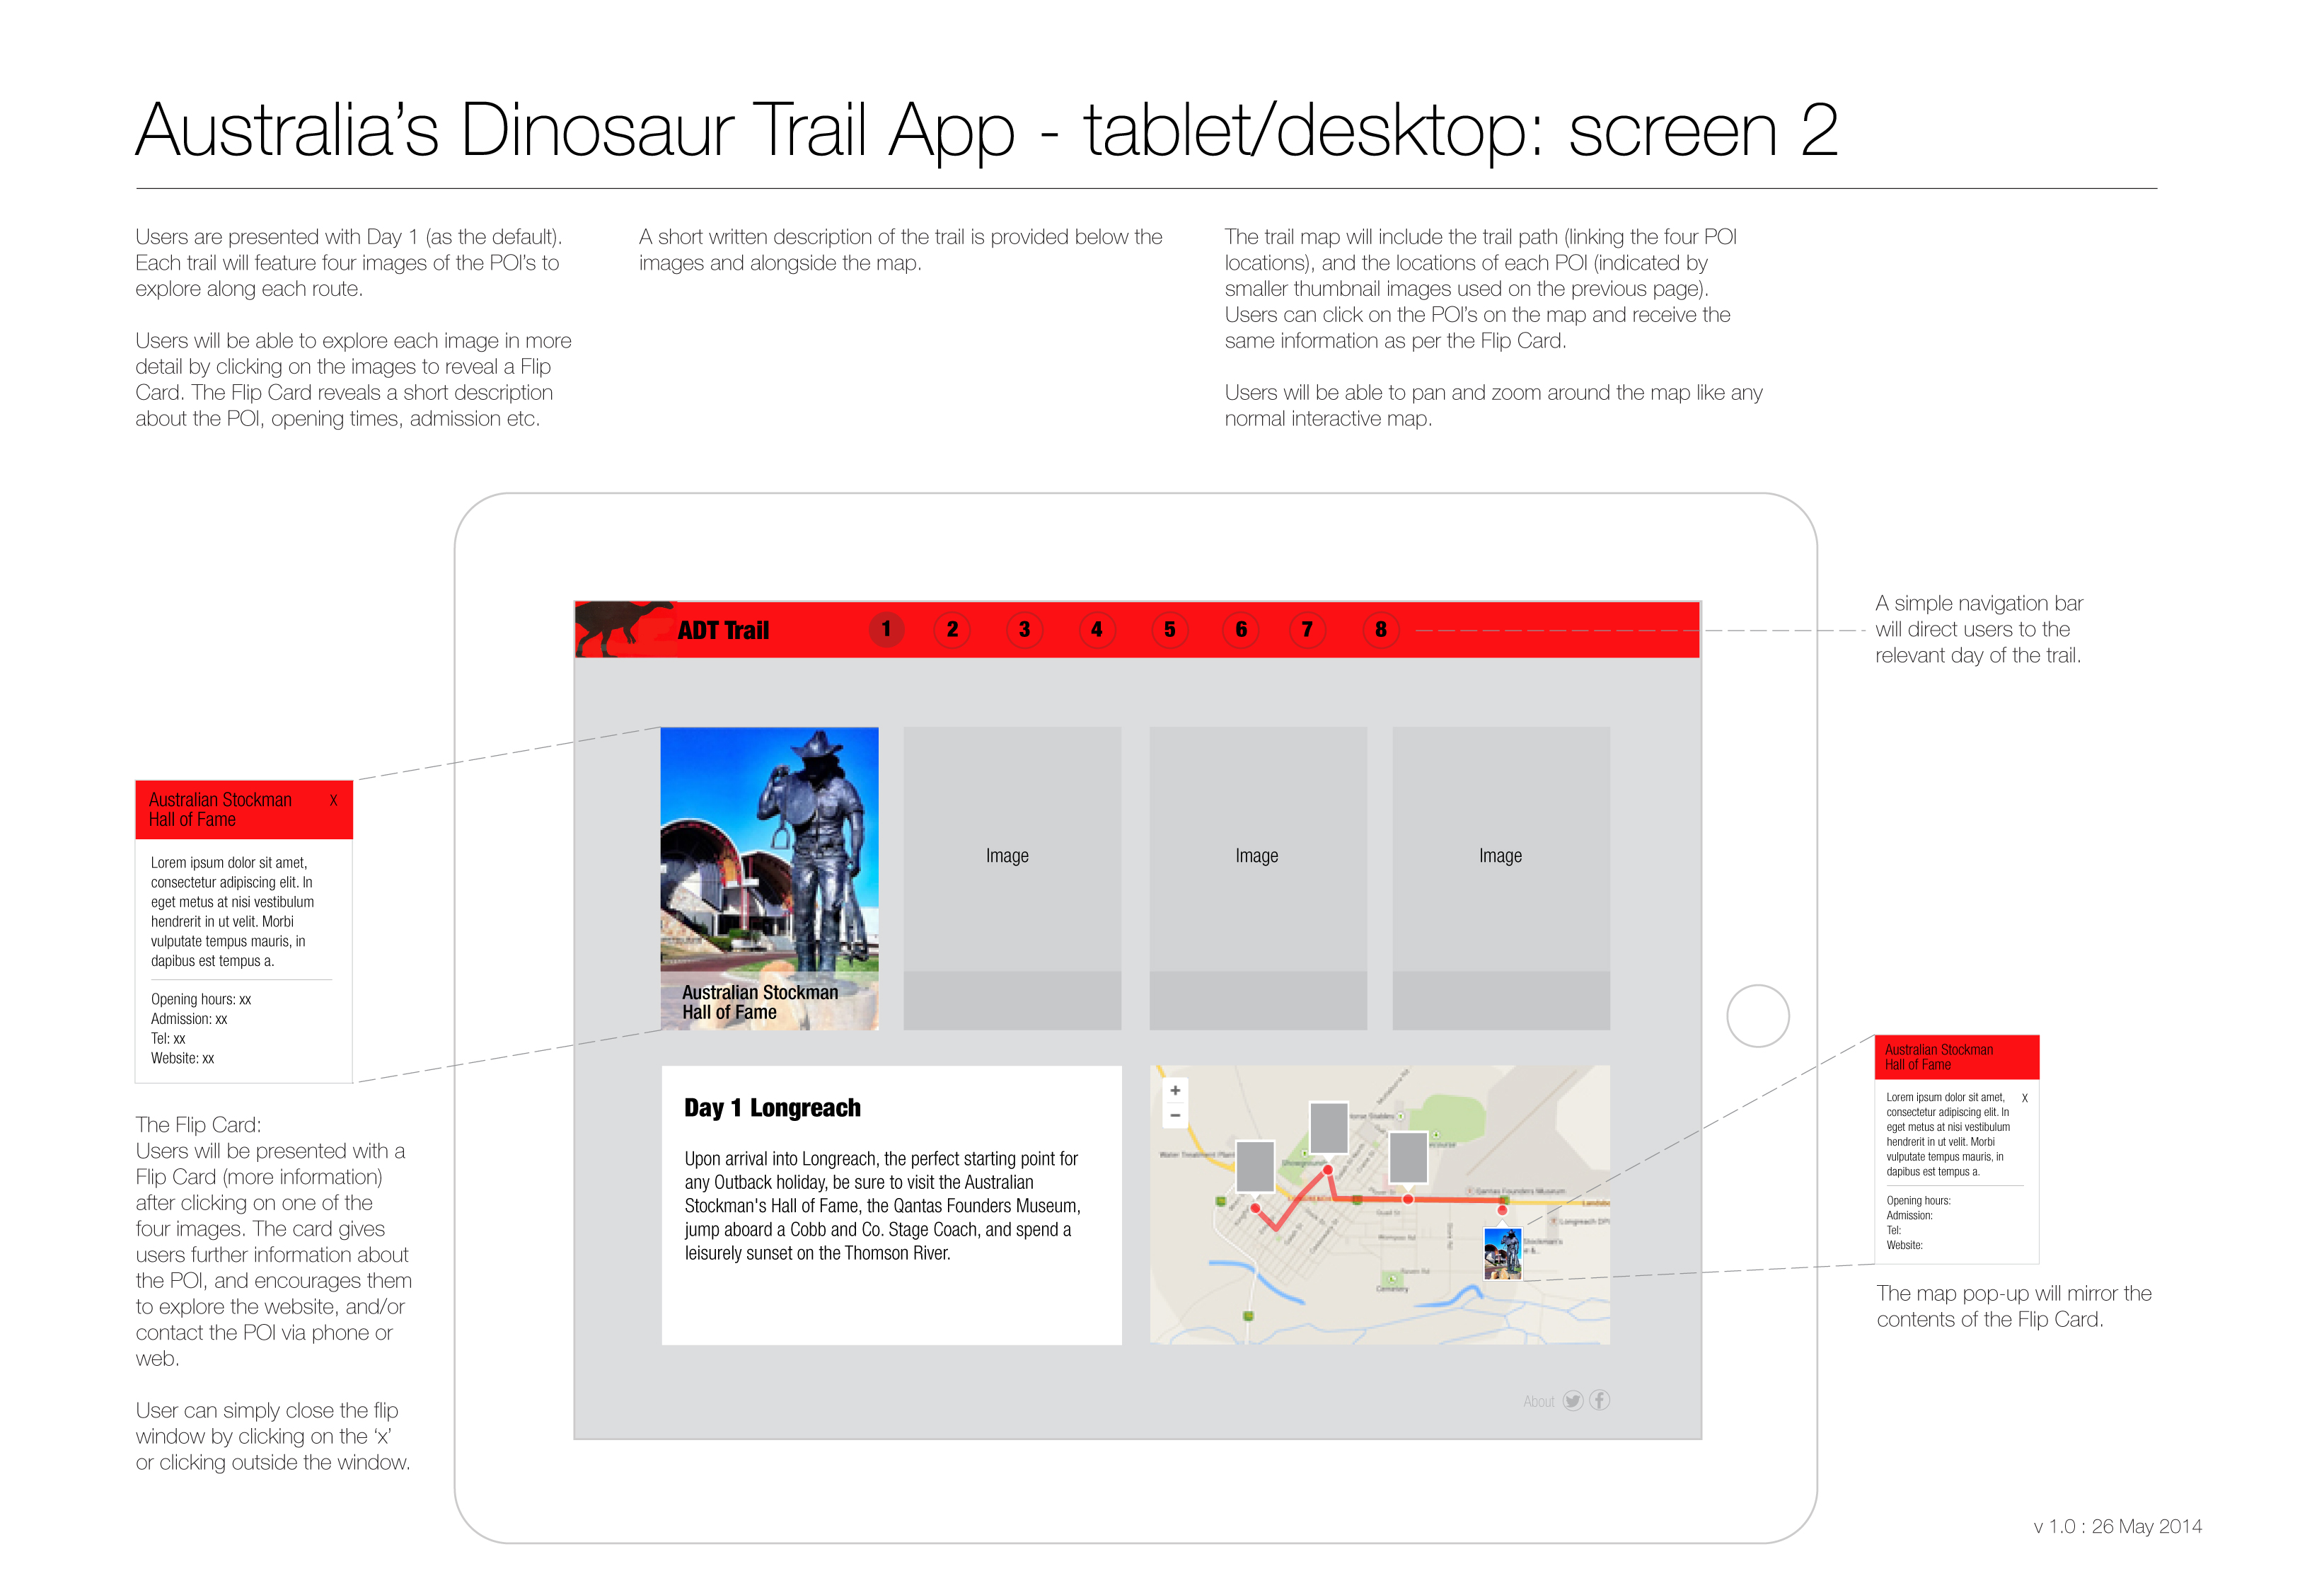
An early mock up of the app can seen below with the POI images arranged horizontally across the page in the order they appeared in the text for each day. The idea was to put the images of the POI’s at the forefront of the app, these were ultimately our Ace cards. This arrangement however meant the map was going to be very small, and it concerned us that the map wouldn’t be useful at this size? After some trial and error we ditched this idea and moved towards a more traditional layout with a simple navigation menu and larger map.
Early visual designs placed the images at the forefront of the app, meaning the map suffered and the app began to look very boxy.
The Real Ace in the Pack
What makes this area so unique is its geological landscape. After all, this was a Dinosaur playground way back when! It’s not until you start exploring the satellite imagery of the area do you really get a sense of this unique landscape. It was here while immersing ourselves in the landscape that we stumbled across our real Ace in the pack. It now made even more sense to make the map our centerpiece of the app.
Queensland’s Outback is littered with amazing landscape. Esri’s imagery basemap provided us with the perfect backdrop for our Dinosaur experience.
Designing the Basemap
We used Esri’s beautiful satellite image basemap as the backdrop to our POI’s. But as beautiful as the imagery was on its own we needed to adds some additional context so users knew where they were, and how the POI’s fitted into the key parts of the landscape.
We couldn’t find a suitable plug-and-play satellite image overlay that we liked so we built our own. Building our own image overlay had several advantages. It gave us the ability to position labels where we needed them so they were never hidden by our POI icons, meaning our users always knew where they were. It meant we could also add custom content to the map like distance rings, which indicated how far each POI was from the nearest town. Our own custom map also meant we could control the finer cartographic subtleties like generalization and transparency that we couldn’t get from other default overlays. Having these finer carto tools at our disposal meant we could really work on tying in the design of the map into the overall look and feel of the application.
Creating our own image overlay meant we could add custom content like distance rings to the map, and it gave us more degrees of cartographic freedom.
Rendering the POI markers on the map
We used Esri Leaflet to render the POI markers on the map, and to style the pop-ups. Leaflet basically creates each marker out of plain old HTML and CSS giving us complete control over the styling and content that goes into the markers and pop-ups. Plus Leaflet has a great built-in clustering algorithm that we wanted to utilize as users zoom out of the map.
A simple circular marker was chosen to display a thumbnail image of each POI on the map. We played around with using a Dinosaur footprint as the marker shape but we couldn’t quite get it work. You will also notice that when you pan the map the POI markers almost disappear. We added this functionality because we wanted to offer users the ability to explore the imagery on its own without the POI’s smothering the map all of the time. We figured this was a neat way of doing this.
Using Colour to aid Navigation
It was important that we made sure users knew where they were in the app at all times. Colour was the obvious choice to group similar elements together. We applied a unique colour band to each POI for each day to tie everything together. This was really important as there are times during navigation that users would see POI’s from multiple days. The colour bands around the POI icons help distinguish them apart, and tell the user which day they belonged to.
Visually linking the map and navigation items together using colour. An early design of the how we saw the navigation menu and POI markers working together.
The Navigation Menu
Each Day of the trail included a short description of the day’s activities. Using the unique colours above we highlighted each POI in the text and added a simple hyperlink which when the user clicked on the POI name the app zoomed directly to that particular POI. The navigation menu served as a place to explore each day of the trail, but is also allowed users to navigate directly to a POI if need be.
The final navigation menu we settled on. Wrapping the colour bands around the images in the nav menu provided a direct visual link to the markers on the map.
The Splash Page
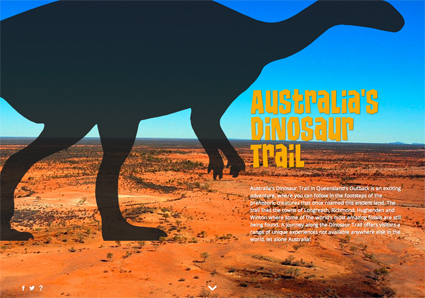
We wanted the splash page to really capture the essence of the type of content the user could expect when they started exploring the app. So we pulled in a dramatic landscape image as a backdrop, and included the large black dinosaur that featured heavily in the branding of the ADT. The splash page provided us with a great launching pad into the app. The final pieces to the app were now complete.
A dramatic landscape image and giant dinosaur dominate the splash page immediately setting the tone of the application.
The Wrap Up
Australia’s Dinosaur Trail is an example of how you can transform a pretty simple set of data into an engaging interactive map. The application provides an interesting way to explore this fascinating part of Queensland’s outback. The combination of some manual data mining, keep-it-simple UX principles, and some carefully thought out old school cartography tricks, coupled with some pretty slick tech made for a fun an enjoyable project to be a part of. We hope visitors to the region share our enthusiasm!
View the interactive dinosaur map here:


